Reports that answer the question
A risk heatmap with your appetite overlaid and a Statement of Applicability straight from your mappings — drawn live from your data and exportable on demand.
Start free trialLive views, built for the conversation
Reports are interactive, on-screen views drawn from your live data — clear, visual, and defensible enough to put in front of a board or an auditor. Two reports ship at launch: a risk heatmap and a Statement of Applicability. Access needs nothing special — if you can read the risks, controls, and actions, you can see the reports that include them.
The board view, at a glance
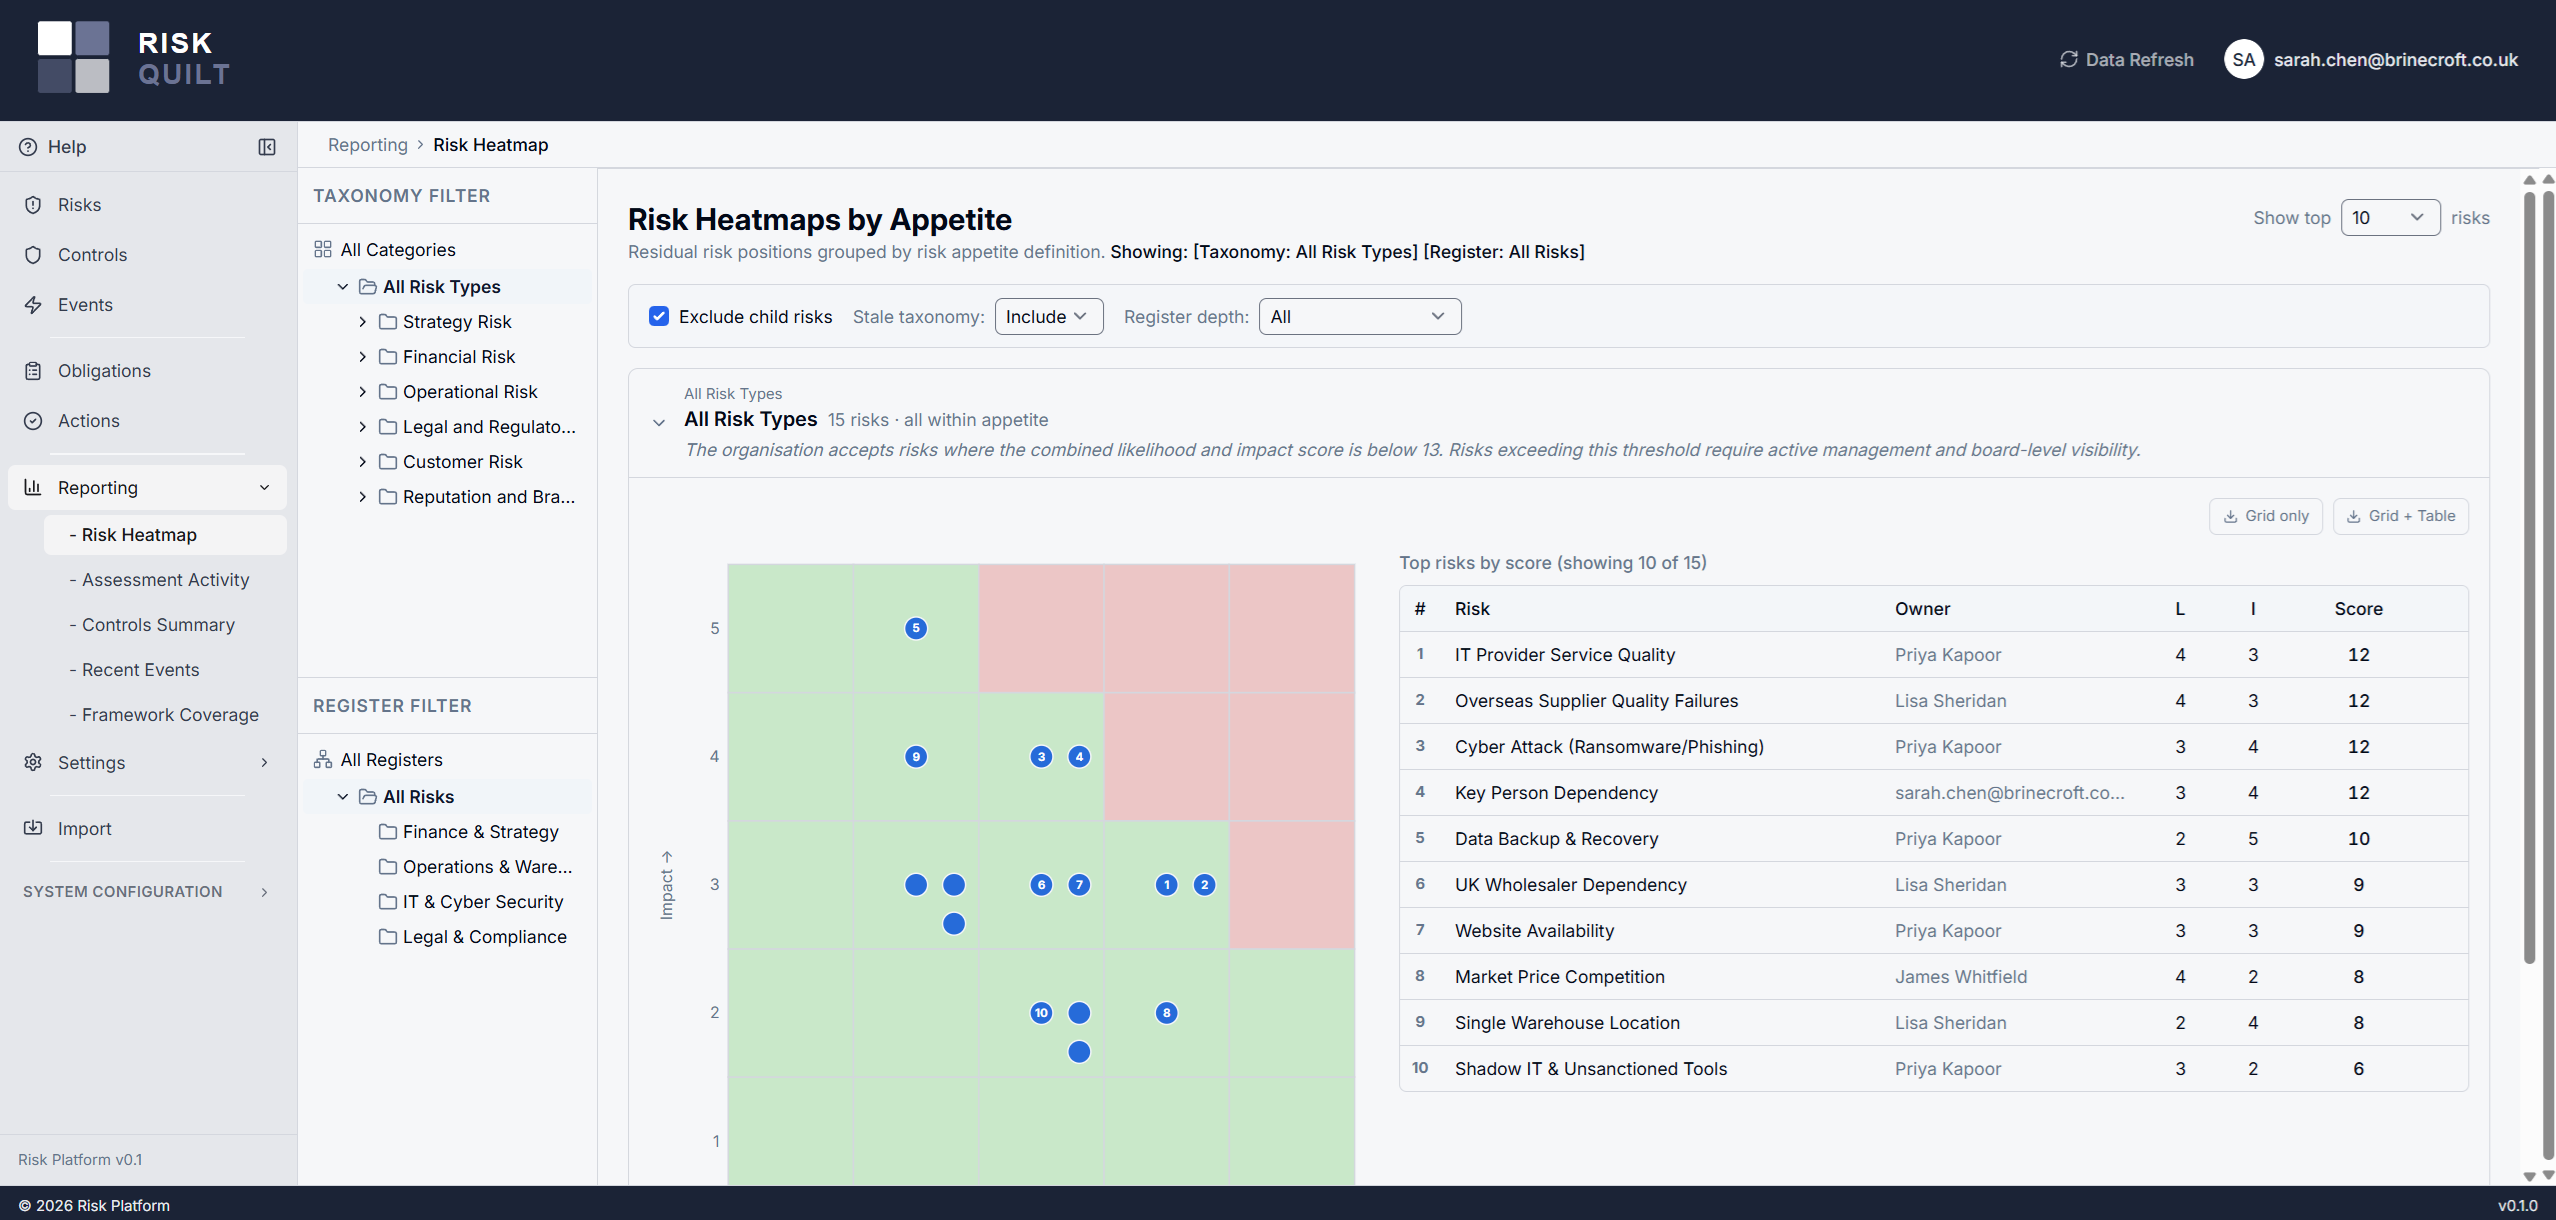
A risk heatmap plots your risks across the likelihood-and-impact grid, with your own risk appetite overlaid as permitted cells. Risks that sit outside appetite are flagged prominently, so the conversation starts with the ones that matter. It's the summary a board wants — top risks, where they sit, and which are beyond the line you've drawn.
The heatmap reflects the scores your owners have set. Nothing is silently averaged or derived behind the scenes — what you see is what your people assessed.
Compliance posture, from live mappings
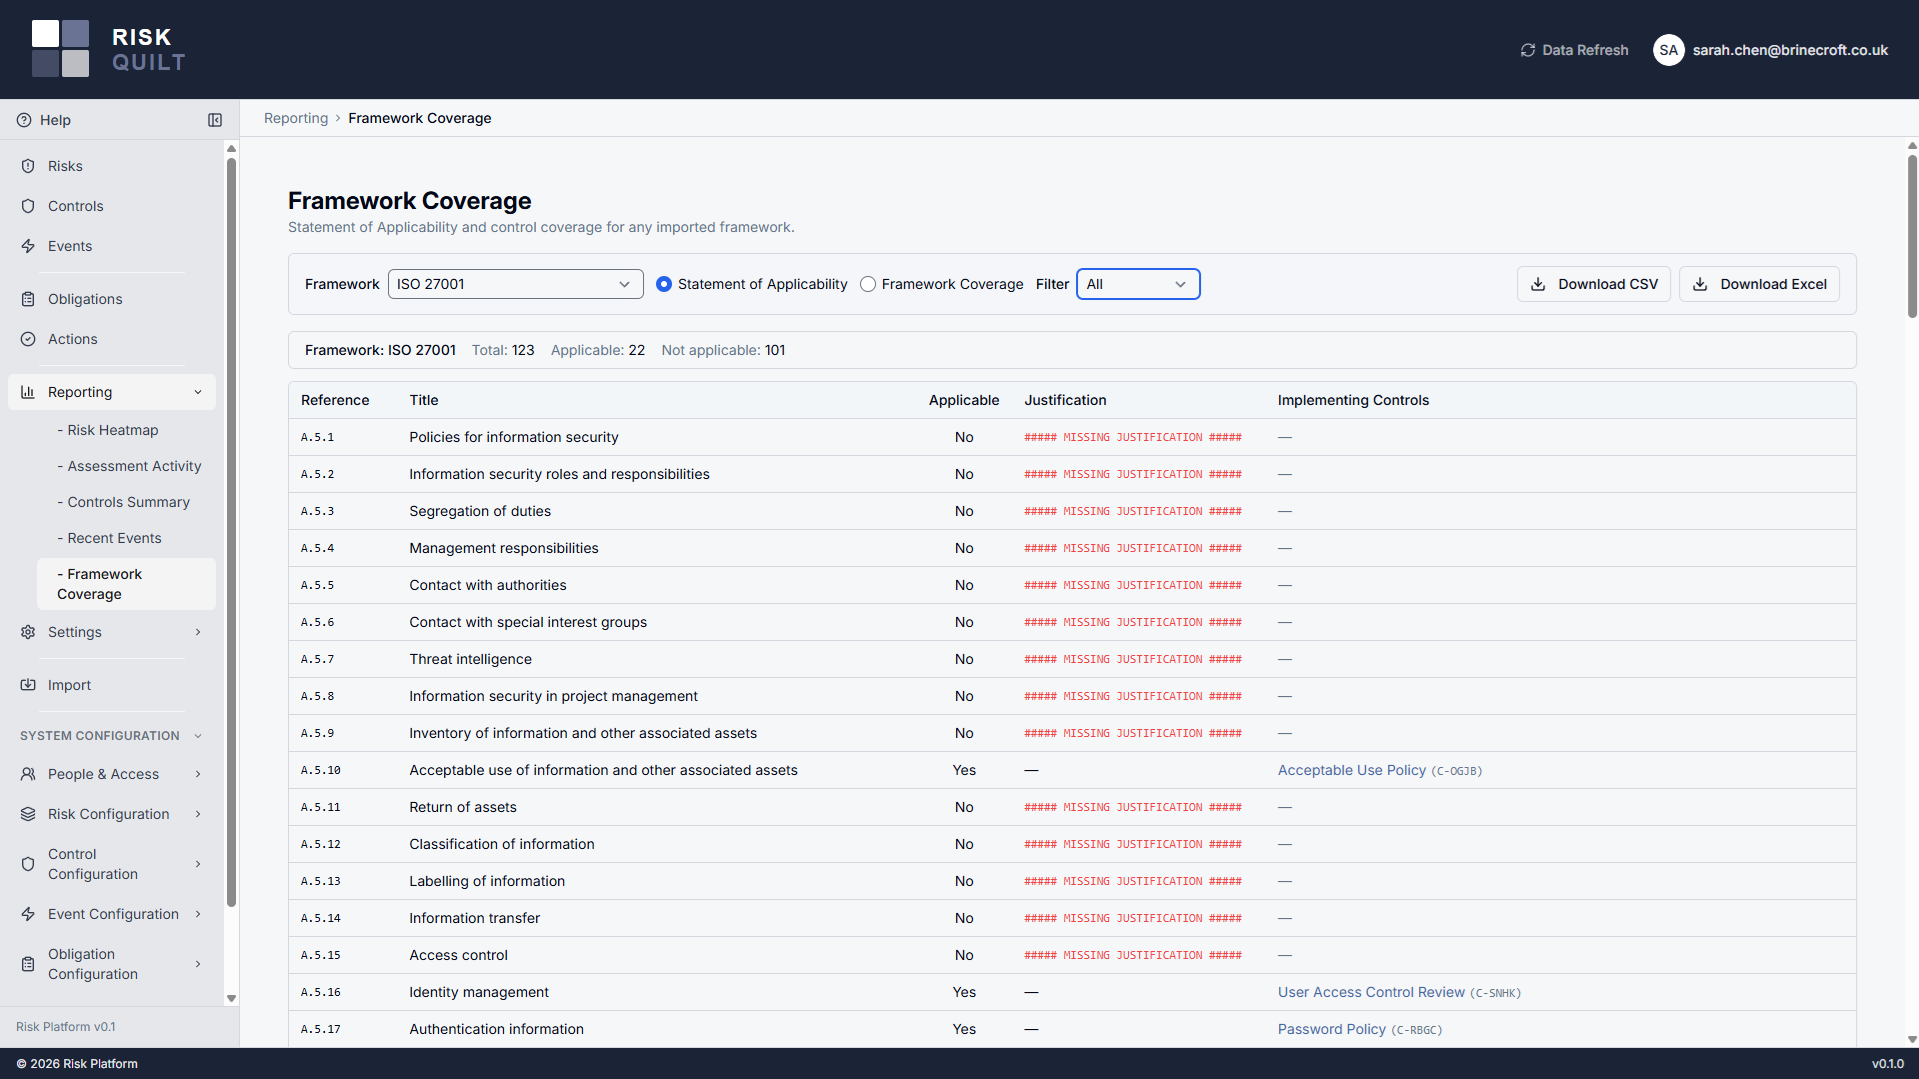
Generate a Statement of Applicability directly from your control-to-requirement mappings — coverage by level, control status, and the gaps, all current the moment you run it. Because it reads from the mappings you already maintain, there's no parallel spreadsheet to reconcile and nothing to rebuild before an audit.
The flags that matter, ready to share
Consistent management signals
Reports surface the same key signals wherever they appear — risks outside appetite, overdue actions, and stale control effectiveness assessments. They're clearly flagged so nothing important hides in the detail. These are signals for judgement, not triggers: they highlight, they don't enforce a workflow or block anything.
Export on demand
Export any report on demand. The export captures the report exactly as you ran it and states the date it was run in the output, so a report you share or file is unambiguous about what it shows and when. No scheduling, no automated distribution to manage — you run it and take it when you need it.
Reporting reads everything else
Risks
The heatmap and out-of-appetite flags read straight from your risk scores and appetite definitions — no separate report data to maintain.
RisksObligations
The Statement of Applicability is your framework mappings, rendered as the report an auditor asks for.
ObligationsControls
Stale effectiveness assessments and overdue work surface as signals, drawn from the controls and actions themselves.
Controls